Feel free to comment. Any questions you can email me at smitha241914@gmail.com
Sunday, July 22, 2012
Looking at possible Aussie and Kiwi long positions.
Feel free to comment. Any questions you can email me at smitha241914@gmail.com

Wednesday, July 18, 2012
Pulled long Trigger on $gbpjpy


Wednesday, July 4, 2012
Friday, June 29, 2012
Saturday, June 23, 2012
Trading Plan: Week of 6/24
 EURUSD- Once the market opens back up on Sunday, I will first move my stop on my short position to the high of this candle (arrow) locking in 70 pips. Slow Stochastics are hinting at a cross and as price stalls at the 4hr 100 ma, we might be due for a bounce. This is also suggesting if we don't open with a gap that will stop me out. I'll look to reenter in the .2600-2650 region. My ultimate short term target is .2450
Friday, May 18, 2012
Trading Plan for Week of 5/20/12 EURUSD and EURJPY
EURUSD


We ending the week with some short covering right at the weekly trendwall dating back to the low of June 2010. The market produced a "not very sexy" hammer which could suggest some further much needed correction is in order. Since we did not close inside of that trendwall, I may look to short on Sunday's open if price action suggests. Nonetheless I am thinking that price will rise to the .2880-.3000 area which I would like the opportunity to short again. Target area will be defined depending on what entry I chose to exercise.
EURJPY
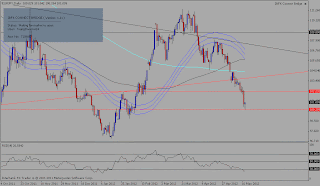
 The hammer on the daily chart looks a lot more appealing than the eurusd chart. With that daily candlestick along with an oversold RSI reading suggests a possible run up to the 102.20 area at which point I will look to short if the signal presents itself. If i do short at that area, I will look to ride back down to the 100.20 area for about 215 pips. On the 1 hr chart, we can see this small head and shoulders pattern with the neckline looking like it has been breached and broken. That pattern can suggest some more bullish momo.


We ending the week with some short covering right at the weekly trendwall dating back to the low of June 2010. The market produced a "not very sexy" hammer which could suggest some further much needed correction is in order. Since we did not close inside of that trendwall, I may look to short on Sunday's open if price action suggests. Nonetheless I am thinking that price will rise to the .2880-.3000 area which I would like the opportunity to short again. Target area will be defined depending on what entry I chose to exercise.
EURJPY


Sunday, April 15, 2012
Target area for $audusd short.

 I entered this trade on Friday after I seen the break of the rising trendwall and hourly 50 ma. Obviously I caught the action a little bit late, but I was still able to get a favorable RR ratio. It opened with a gap down from looming Spain debt concerns and now is looking for support. Currently battling the 4hr 50 ma (3150) area, I'll be looking at .0280 as my first target and then closing the rest of my position at 0250. I have .0350 as my resistance and any 4hr candle closings above that area and I'll maybe get stopped out just in case it decides to reverse.
Subscribe to:
Posts (Atom)